Death Becomes Her, or Why Aging is an Epigenetic Program
Evidence in support of the Strong Epigenetic Theory of Aging

Why am I such a huge fan of epigenetic clocks? Well, because in addition to being the most accurate predictors of our remaining lifespan — better than our passports or any other biomarker — to me they also provide evidence for a hypothesis I consider critical to defeating aging. The hypothesis that aging is an epigenetic program.
These days, most aging researchers agree that epigenetics play an important role in aging, and many, like David Sinclair, go so far as to recognize the role of epigenetics as critical. However, the way David formulates his Information Theory of Aging, the epigenetic changes observed during aging are seen as consequences, i.e. responses to various random or environmental factors (DNA damage, etc.):
Youth → broken DNA → genome instability → disruption of DNA packaging and gene regulation (the epigenome) → loss of cell identity → cellular senescence → disease → death (p.41).
I call that the Weak Epigenetic Theory of Aging. In contrast, I believe that, while there definitely are some epigenetic changes occurring in response to the environment, when it comes to aging, practically all of it is driven by epigenetic changes pre-programmed in our DNA — just as embryogenesis, childhood, or puberty are driven by their own pre-programmed epigenetic changes. In other words, aging is programmed, and “wear and tear” barely makes a dent in how long a given species can live. That’s my Strong Epigenetic Theory of Aging.
I see a lot of evidence in support of it. Some of the strongest evidence comes from the existence of epigenetic DNA methylation clocks in many species. What is surprising about those clocks is that with age in mammals, DNA methylation is not just stochastically diluted (or “washed out”), as one might expect if it were a random process, but more often, on the contrary, methylation increases, which usually correlates with a decrease in the expression of various necessary (or “good”) genes. Why “good” or necessary? Well, because if those genes weren’t needed in adulthood, they would have been turned off abruptly after puberty, rather than being gradually turned down as we age.
There are plenty of observations in various animals of such “good” genes having their expression levels gradually decreased with age, and new examples are constantly emerging. A bit later I will return to this topic and cite several great papers that have shown such a decrease in different species.
At the same time, an opposite process is also observed: some “bad” genes that are rather detrimental, such as harmful retrotransposons, are gradually being released from their epigenetic prison as we age. Transposons are highly repressed until adulthood but then gradually they start being more and more active, bombarding our genes with their copies. This eventually may lead to hyperactivation of innate immunity, that is, to the notorious “inflammaging” — sterile age-related inflammation, which is almost universally observed in elderly people and animals.
Why does our body allow transposons to be activated after a certain age? After all, as examples of other genes demonstrate, our organism is perfectly capable of maintaining or even increasing DNA methylation levels with age. And for precious germ cells, which are forced to reset their methylation after fertilization, the body has an additional defense mechanism against them — piRNA. So why, at the end of reproductive age, are transposons set free and allowed to wreak havoc? Is that just indifference of our genetic overlords towards their “disposable soma” which has outlived its reproductive purpose, or is that deliberate phenoptosis, i.e. are our genes trying to kill us?
It seems to me that it’s the latter. Let me explain why. In nature there is a very illustrative example of social animals: bees, ants, termites. Those animals have at least two castes: workers and breeders, and despite sharing identical DNA, breeders outlive workers by 10–100 times. Why are the “good” genes that help breeders live so long silenced in their worker twins?
Mirroring the observations of piRNA being active in our germ cells but silenced in “worker” cells, a similar observation was made in social animals: the queens enjoyed the protection of piRNA for many years, while the worker caste had its protection decreased in a matter of months:
Strikingly, genes from the PIWI-interacting RNA (piRNA) pathway, which are generally known to silence [transposable elements] in the germline of multicellular animals, were down-regulated only in old major workers but not in reproductives.
To me it seems pretty obvious that the genes just don’t allow the workers to live very long. Basically, the genes kill their workers 10–100x sooner than they do their reproductives. But this line of thinking seems blasphemous to the authors of the above observations, and they are trying to find an excuse why genes might be perpetrating this to the workers:
“It would, after all, probably be too energetically costly to maintain an active piRNA signalling pathway permanently in all the cells of an organism — or in all the individuals of a colony.”
“Too energetically costly”? I am not convinced. It’s not too costly for a queen which simultaneously lays her weight in eggs every day (20,000 eggs!), but it is costly in a worker? And what kind of energy are we talking about, food? Or was that a reference to the “trade-off” hypothesis of aging, which the queen is somehow excluded from?
An even more egregious example of genetic voluntarism in choosing how long to let their creatures live is the Monarch butterfly. In the summer, these butterflies live only a few weeks, but in the fall they migrate south for wintering, and those migrants can live up to 9 months. Moreover, these very same migrants not only have to fly for thousands of miles back and forth, but in the spring, the females that fly back do so while pregnant. Why else can’t their summer brethren live at least as long if it’s not for the genes deliberately killing them?
The Great Gladyshev Group Paper
Let us put murderous genes and transposons aside for now, and return to methylation clocks. In particular, I would like to analyze in detail an excellent work from Vadim Gladyshev’s group, in which they thoroughly analyzed what happens to methylation as we get older (or as mice do, to be precise). The authors have collected mouse methylation profiles at a whopping 16 time points — i.e. practically every 2 months of a mouse’s short life. Moreover, the profiles they collected spanned not just a few hundred methylation sites, but as many as 800,000 of which just over 20% changed significantly with age.
By the way, it is worth noting that for their paper the authors used data on age-related changes in murine methylome, obtained by their colleagues from the same lab in an earlier work. In that original work, the authors had created a novel methylation clock for mice and, more importantly, have shown that this clock is delayed by various interventions that are know to extend lifespan (caloric restriction, rapamycin, etc.). By the way, that novel Gladyshev methylation clock was praised by Steve Horvath himself, the most famous epigenetic clockmaker.
So what was so captivating for me in the Gladyshev group paper? First, the following observations:
We found 102 significantly enriched pathways (adjusted p-value < .05) associated with the loss of methylation and 1,162 pathways associated with its gain in promoters during aging. Among the pathways with decreased methylation were those related to DNA repair, immune processes, and inflammation. In the increasing group, the most overrepresented pathways were related to developmental processes. There were also significantly enriched pathways related to aging and lifespan-extending interventions, such as the response to growth factors, insulin-like growth factor and TGFβ, MAPK cascade, WNT and Notch signaling pathway, regulation of stem cells, estradiol response, and fatty acid metabolism- and transcription regulation-related pathways.
We also investigated the enrichment for genes (Table S6) and found 39 significant pathways that lost methylation and 987 pathways that gained it during aging. We observed similar patterns in gene bodies compared to promoters. Pathways with decreasing DNA methylation included DNA repair, immune function, and inflammation-related pathways, and those with increasing methylation included various developmental pathways. There were aging-related enriched pathways in the increasing group, including regulation of cell aging and senescence, growth factor response such as the response to TGFβ stimulus, stem cell proliferation and differentiation, MAPK cascade, WNT, Notch signaling, and fatty acid metabolism-related pathways (Figure S9). In addition, a pathway involving DNA methylation itself was detected, including the gene DNMT1.
That is, what do we see? That there are 10x (!) more gene pathways where methylation increases with age, which usually correlates with a decrease in gene expression, than pathways where the opposite happens. Moreover, it seems that methylation also increases in some “gears” of the methylation mechanism itself, such as DNMT1, one of the functions of which is to duplicate methyl labels during DNA replication from the original strand to the one being built. Could this be why some harmful genes like transposons gradually escape from their epigenetic prisons as the efficiency of the systems for maintaining their methylation decreases? This “escape of the transposons” seems all the more odd when considered against the background of the body having enough resources and “resolve” to increase methylation (which takes effort and energy to do) of many previously active genes. Well, at least it seems odd to those who do not believe that genes can deliberately try to slowly kill their hosts. In the framework of programmed aging it actually makes perfect sense.
But you know what’s funny? That the authors of the Gladyshev paper are staunch “stochastics”, i.e. opponents of programmed aging who instead believe that aging is caused by random accumulation of damage. Here is how one of the co-authors, Alexander Tyshkovsky, interprets what he observed (translated from Russian):
Concerning [methylation] clocks and their determinism. When we analyzed the specific changes in the methylation profile with age, we saw 2 main patterns.
The first is an increase in entropy (explains the change in methylation status with age for more than half of the sites). Sites that are fully methylated begin to demethylate with age, and vice versa. Are these changes deterministic? Yes, absolutely. Are they programmed? No, because they are explained by pure stochastics: the methylation level of fully methylated sites cannot get any higher, it can only decrease (which is what happens), the opposite is true for fully demethylated sites. In other words, their methylation status moves towards the mean from different directions as a consequence of falling control over the methylation status.
The second pattern is a drop in methylation (and an increase in activation) of genes associated with maintaining the body and repairing damage (for example, genes for DNA repair and immune response). Is this a program? Yes. But not an aging program, but a program for repairing damage that increases with age. When the car is out of order, the owner is “programmed” to take it to the mechanic. But this does not mean that there is a car breakdown program.
Not Entropy Again
Oh, this entropy. Every now and then comes up in conversations about aging. Well, yes, yes, as we age, entropy increases — and for some reason at very different rates in different species — but not because some physical law compels it to increase, but because genes allow it to and even help at some point. When genes need to reduce entropy of an organism, they do so marvelously — during embryogenesis, for example, or during puberty. Some species can even regrow severed limbs or even a head, as planaria do.
To me it is pretty clear that the reason for aging cannot be “entropy” or, more accurately, the Second Law of Thermodynamics, which states that in isolated systems entropy cannot decrease. By the way, this “cannot decrease” for some reason is often transformed into “must increase”. Moreover, the time frames in which this entropy is obliged to increase in not usually specified. In any case, there is no point in trying to discuss shades of gray when we are obviously looking at green: living organisms are not isolated systems. Quite the opposite, all they do is absorb energy from the outside and use it for various needs, including for reducing their entropy.
But let’s get back to Alexander’s thesis on entropy. On the basis of what data did he draw his conclusions? Judging by the graphs in their paper, based on these data for mice:
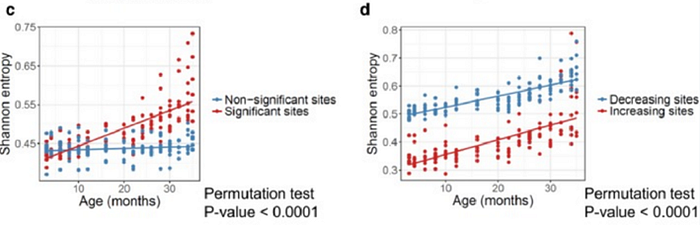
(D) Shannon entropy of the sites that significantly increase and decrease with age.
…and these data for humans:
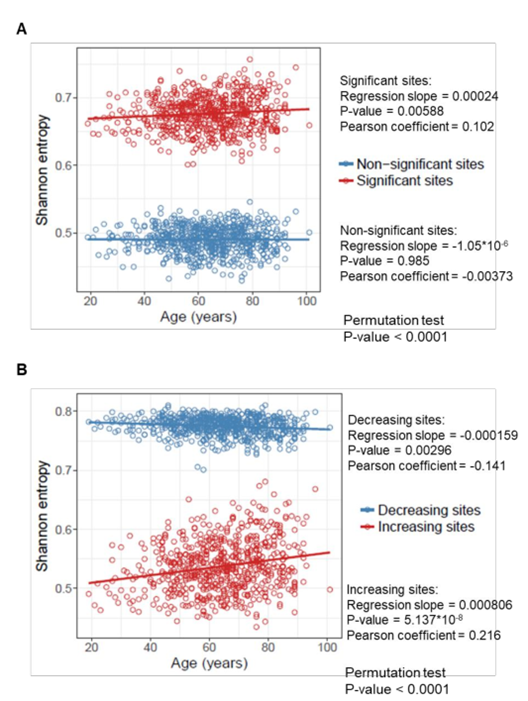
(A) Shannon entropy of the sites that significantly change (or do not change) with age in 651 human samples from the age of 19 to 101 years. Permutation test was performed to assess the difference in entropy between changing and non-changing groups.
(B) Shannon entropy of the sites that significantly increase and decrease with age in 651 human samples from the age of 19 to 101 years. Permutation test was performed to assess the difference in entropy for increasing and decreasing groups.
Personally, I do not see a notable increase in entropy here, especially in humans. On the contrary, average entropy of methylation sites is surprisingly stable with age. Moreover, for those human sites where methylation decreases with age, the entropy actually slightly drops (bottom graph, blue dots).
By the way, the age-related decrease in the entropy of human methylation sites shown in the graphs above is in line with a very curious phenomenon: after age 75–80, the spread in epigenetics between different people, instead of monotonically increasing, begins to actually decrease. The researchers saw this in twins at first:
There is experimental evidence suggesting that epigenetic fluctuations may stop diverging in very old individuals. In twin studies, variation in global genome methylation increased gradually until 75 years of age but showed a decreasing trend in the oldest twin group (76–88 years) [17]. Likewise, methylation patterns of distant CpGs (1–5 kb) become more similar in older individuals.
And later as a general phenomenon:
Age-dependent epigenetic divergence, paradoxically, changes to convergence in the later stages of life.
…
We find that brain tissues of older individuals (>75 years) become more similar to each other, both epigenetically and transcriptionally, compared with younger individuals.
Let me go out on a limb here for a second — I think we might observe something similar in real life. The spread in health levels of people in the 50–60 age cohort is quite large: at this age there are still many people in perfect health but also many people with debilitating disease, while at age 90, almost everyone is quite decrepit. Perhaps this is what the dynamics of methylation reflect. And this is very sad, because it shows that no matter how hard we try to keep ourselves young by leading a healthy lifestyle, it seems that by a certain age we will still catch up with our less disciplined peers in terms of decrepitude. That is, our aging trajectories will inevitably converge.
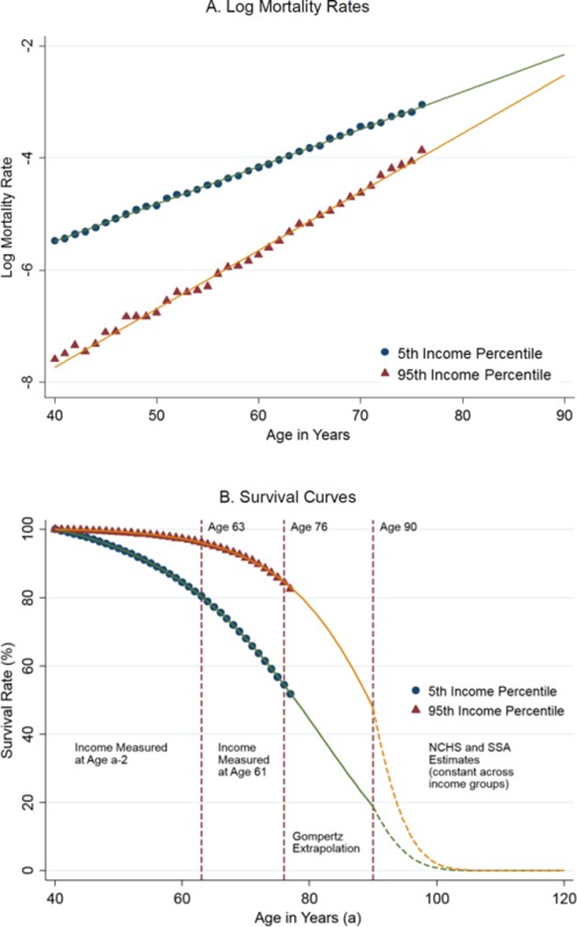
By the way, it’s funny that the convergence of aging trajectories can also be traced between the rich and the poor — money can significantly increase your chances of living to 75, but not 100:
Okay, back to our mice and their entropy. The last thing I wanted to say on this topic is that if you look closely, you can see that during the overwhelming majority of murine life, the level of entropy of their methylation remains approximately unchanged — almost up to 2 years of life (and the average lifespan of a mouse is 2.5 years):
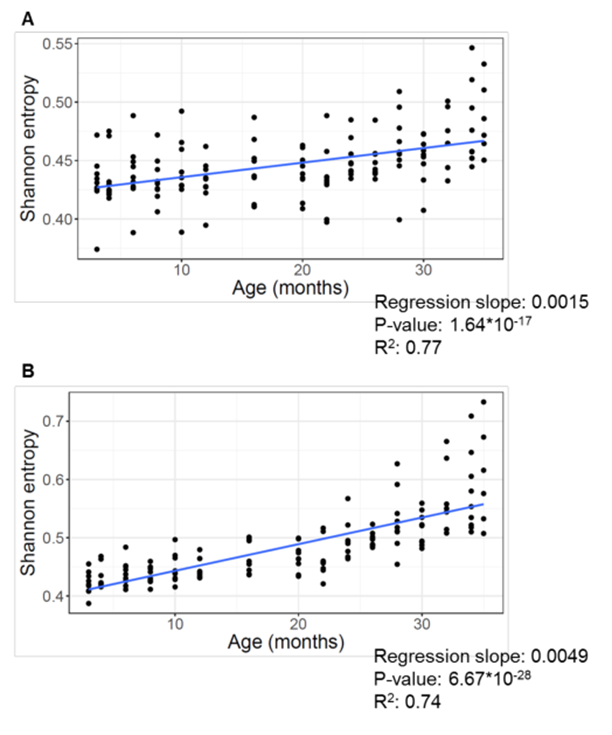
(A) Shannon entropy of 141 C57BL/6 mouse samples, calculated for every site.
(B) Shannon entropy of the same samples, calculated only for the sites that significantly change with age.
If we ignore for a second the final months of murine short life (after 22–24 months), then for the first two years entropy is practically unchanged.
Methylation with Age
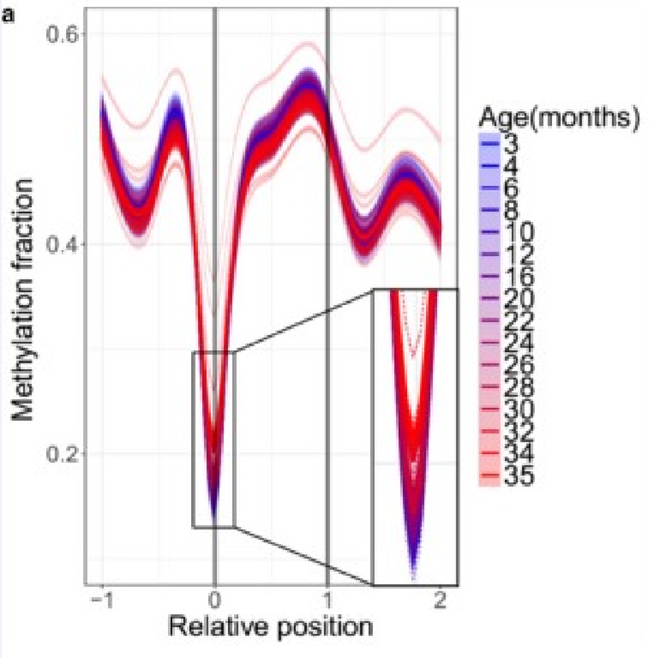
Ok, let’s put entropy aside for now. Let’s take a closer look at methylation levels themselves. How accurate is the thesis that methylation changes “are explained by pure stochastics: the methylation level of fully methylated sites cannot get any higher, it can only decrease (which is what happens), the opposite is true for fully demethylated sites”? Here is a very revealing graph of methylation changes of all hundreds of thousands of sites that the authors looked at:

(b) Same as in (a), but the plots include only the CpG sites that significantly change with age.
On the left are all sites in general, and on the right are only those that change significantly with age. What do we see? That the global methylation pattern changes very little with age: in the left graph, the blue curves (young mice) are practically indistinguishable from the red ones (old mice). And even if you look only at those sites that change significantly with age, the picture does not differ dramatically. Moreover, the main changes take place at a fairly mature age (after 20 months).
This is seen even more clearly if we look at biologically significant sites rather than all of them. For example, sites at the initial regions of genes (where methylation levels are usually inversely correlated with gene expression):
The age when the curves start to turn red is 20–22 months. As can be seen from the graph above, up to this age methylation levels at the start of genes remain practically unchanged. And afterwards it does not grow as much as in other places.
In other biologically significant zones, more pronounced dynamics are visible. For example, methylation levels of long non-coding RNAs (lncRNAs), which are an important mechanism for epigenetic “fine-tuning” of various cellular processes. Their methylation begins to increase even at the “blue” age, and varies much more noticeably with age:
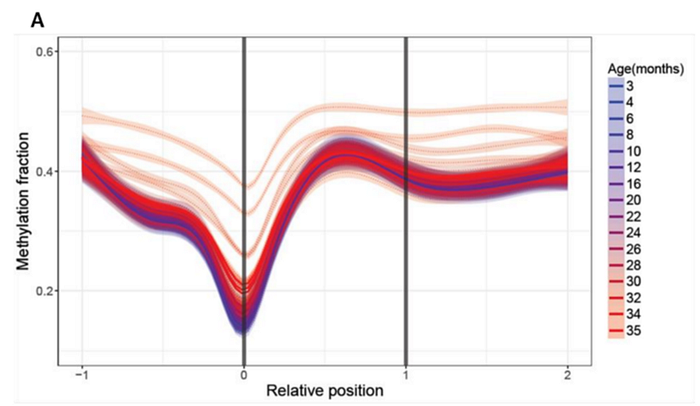
(A) Age-related changes in methylation of long non-coding RNAs. Relative positions are shown as 0 (where the element begins) and 1 (where the element ends) and extended upstream (-1) and downstream (2) according to the length of the genomic region. Lines were calculated by generalized additive model based on the significantly changed sites. Color scheme shows the age, dotted lines show individual samples, and thick lines show age groups.
In the case of harmful transposons, the dynamics are reversed; their methylation levels decrease with age:
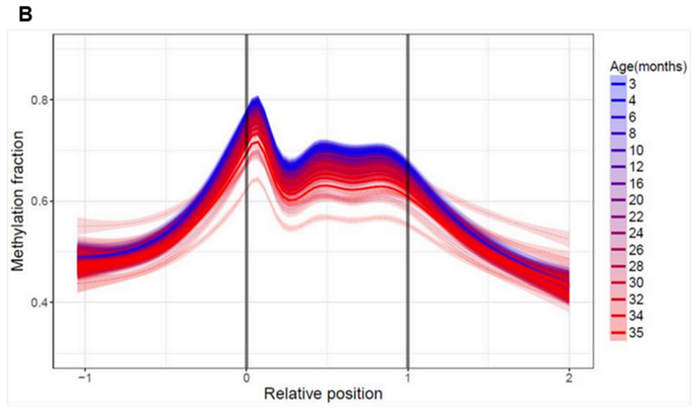
Moreover, their methylation levels decrease at a fairly high speed and with an early, “blue” start. That is, these ancient jumping genes wake up in mice long before old age, and with each subsequent month their activity increases.
And formally — yes, methylation often falls or rises in the direction of the average value of 0.5. But! Even if a decrease in methylation can be reasonably explained by passive “dilution” during DNA copying (say, because DNMT1 could not reproduce all methyl labels with 100% accuracy), an increase in mentylation by some random process is difficult to explain. That’s because DNA methylation is an active process that requires an expenditure of energy and effort: methyl tags will not attach themselves to CpG cytosines of their own volition. To paraphrase Mayakovsky, if the tags are attached, there is someone who needs it.
Moreover, we see that in biologically significant regions — for example, in promoters or in first exons, an increase in methylation occurs much more often than a decrease. Now is a good time to recall the initial quote from the authors of this work which I cited above, that there were 10 times more increasing methylation sites than decreasing ones. This graph shows the dynamics of methylation in other functionally significant regions of the genome:
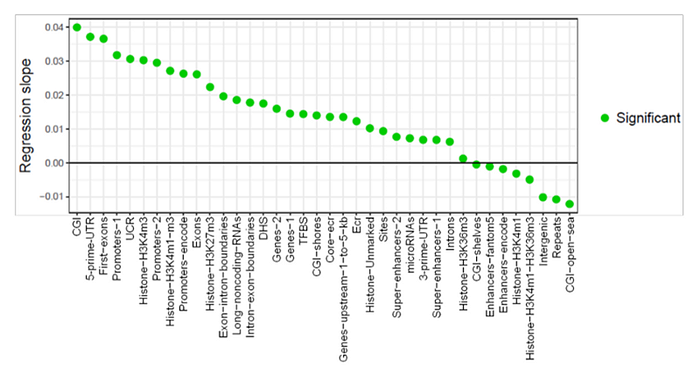
As we can see, the number of functional areas where methylation increases (regression slope > 0) overshadows areas where it decreases (slope < 0). I would like to highlight those regions, the increase in methylation of which usually correlates with a decrease in the expression of their genes — promoters, 5'UTRs, and first exons. In the graph above, their methylation increases at the fastest rate: their regression slope is 0.03. Judging by other graphs in the article, the units of this slope are the percentage of change in the methylation levels over 1 month of a mouse’s life. That is, the methylation level of each genomic region is normalized from 0% (not methylated at all) to 100% (completely methylated), and thus a value of 0.03 for the slope of the regression line means that, in 1 month, the methylation level of these elements, on average, increases by 3%, and in 30 months — by 90% (that is, growth without compounding). A negative value means methylation decreases with age.
A reasonable question is how the methylation level of CpG islands (methylation islands) can grow at a rate of 4% per month — after all, then, in 30 months of an average mouse’s life, the methylation of these areas should exceed the theoretical limit of 100%. Perhaps this is an artifact of linear regression for nonlinear data — I will assume that the methylation of these areas greatly increases in the first 20 months of mice life, and in the remaining months it practically does not change.
Although to see the rate of increase in methylation of the first exons at 3.5% per month is also very strange, because in the general graph of the initial regions of genes, we see that over the entire life of a mouse, the level of their methylation increases by no more than 20% — from 10% to 30% (or even only up to 25%, if you look closely):

In other graphs, the difference in methylation levels between 3- and 35-month-old mice rarely exceeds 30%. Therefore, I am still unsure how the authors have ended up with such high slopes for their regressions.
What happens to the sites in methylation clocks?
An analysis of 800,000 methylation sites is definitely interesting, but maybe in such a large amount of information we are missing some processes critical to aging? Let us put aside all methylation sites and for a moment focus just on those that are included in methylation clocks, that is, sites whose age-related dynamics are conserved between different individuals of the same age. After all, methylation clocks have just dozens or hundreds of sites rather than 800,000, and those sites are special because in some clocks they change alike for both rapidly dividing cells and for cells that do not divide at all with age or do so slowly.
This to me is a great property of methylation clocks: the most accurate of them (for example, the Horvath clock) show practically the same “time” in very different cells types: e.g. neurons, lymphocytes, and in dozens of other tissues:

It is rather surprising, as very different genes are active in a neuron and a T-cell; moreover, these types of cells go through a very different number of cell divisions during a lifetime of their host. And the fact that in both of them some of the same epigenetic processes are proceeding at the same speed — that’s a big surprise! Moreover, to think that these same epigenetic processes are synchronized across many tissues for a hundred years just boggles the mind. Take that, Second Law!
Do you know what is even crazier? That the human methylation clock works pretty well for chimpanzees (adjusted for the rate of aging, of course). Steve Horvath was so inspired by this that he is now working to create a universal methylation clock for all mammals. If he succeeds, then such a clock may well bring us closer to answering the favorite question of stochastics: “So where are your pro-aging genes?” Because the current answer “in the same place as the genes responsible for timing of embryogenesis and puberty”, although logically correct, from the point of view of fighting aging, is rather useless.
Ok, so what does happen to methylation clock sites as we age? Do the changes in them correspond to Alexander’s thesis about stochastic drift towards the mean? Let’s take the Horvath clock and see! Fortunately, he kindly made public not only the regression file, but also included statistics on the median methylation levels of young (under 35) and elderly cohorts (over 55). In the graph below, I plotted these curves by sorting all 353 Horvath CpG methylation sites by median methylation level in the young cohort. That is, the blue curve in the graph below is the median methylation level in young people, and the red curve is the median methylation level of the same sites in the elderly:
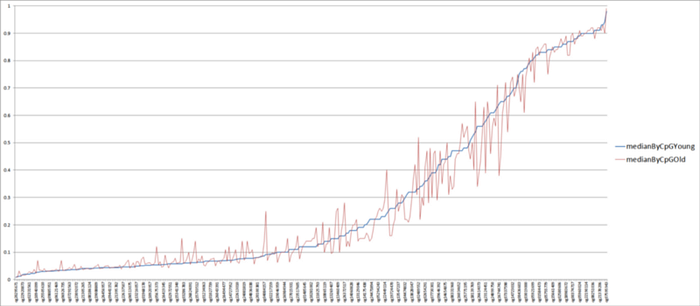
What do we see? First, we see a clear confirmation that the age-related change in methylation in Horvat’s clock is multidirectional: in about half of the sites, methylation increases, and in the other half, it decreases (oscillation of the red curve around the blue). Second, we see that many age-related changes are directed not towards the average methylation value (0.5), but away from it. And thirdly, we see that in the vast majority of sites, the difference in methylation levels between young and old values is very small. To better see the last thesis, here is a more visual graph of the absolute difference in median methylation levels between the cohorts of young and elderly (sorted in ascending order of this difference):
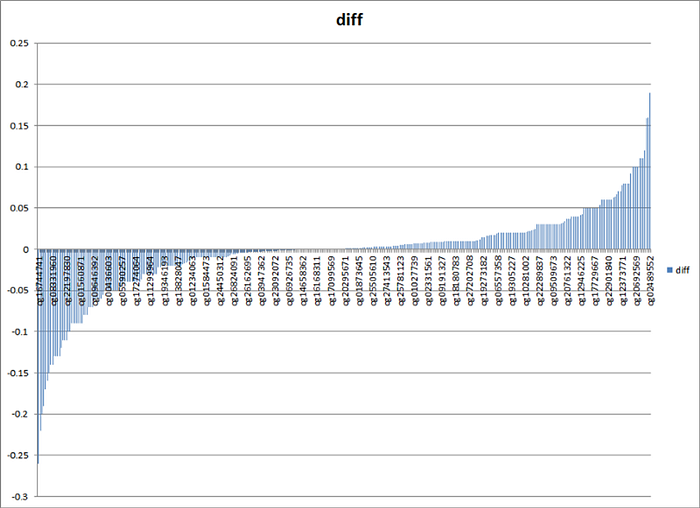
As you can see, for 90% of sites, the absolute increase or decrease in methylation does not exceed 10%. To me, this graph just doesn’t fit with stochastic, random changes at all.
What genes in methylation clocks change the most with age?
By the way, I was curious, what are the genes in which the remaining 10% of sites are located — that is, those where methylation varies greatly between the young and the old? Here are the top 20 sites on each side:

Alas, this does not tell me much — well, yes, methylation decreases with age in some activator of lymphocytes, increases in some ribosomal protein, but, in general, everything is vague. Fortunately, there are much smarter people who were also curious about the answer to the same question and who did a more thorough analysis. These people are Morgan Levine and her co-authors, the creators of the PhenoAge methylation clock. In her clock, Morgan saw the following functional changes with age:
Among those with positive aging associations (overexpression among epigenetically older individuals), we observed enrichment for a number of pro-inflammatory signaling pathways.
These pathways included, but are not limited to: multiple toll-like receptor signaling pathways (7,9,3,2), regulation of inflammatory response, JAK-STAT cascade, response to lipopolysaccharide, tumor necrosis factor-mediated signaling pathway, and positive regulation of NF-kappaB transcription factor activity. Additionally, positively associated genes were also enriched for a number anti-viral response pathways — type I interferon signaling, defense response to virus, interferon-gamma-mediated signaling pathway, cellular response to interferon-alpha, etc. Other interesting GO terms enriched among positively associated genes included: response to nutrient, JAK-STAT cascade involved in growth hormone signaling pathway, multicellular organism growth, and regulation of DNA methylation.
When testing for enrichment among genes that were negatively associated with DNAm PhenoAgeAccel (decreased expression among epigenetically older persons) we observed that many were implicated in processes involving transcriptional and translational machinery, as well as damage recognition and repair.
These included: translational initiation; regulation of translational initiation; ribosomal large subunit assembly; ribosomal small subunit assembly; translational elongation; transcription initiation from RNA polymerase I promoter; transcription-coupled nucleotide-excision repair; nucleotide-excision repair, DNA incision, 5'-to lesion; nucleotide-excision repair, DNA damage recognition; DNA damage response, detection of DNA damage; and regulation of DNA damage checkpoint.
Something caught my eye here: the fact that chronic inflammation grows with age has been known for a while, but to see another confirmation of the global activation of type 1 interferon response was very interesting. After all, this ancient response is tailored to the fight against viruses (“Alert, DNA in the cytoplasm detected!”), and there is evidence (1, 2, 3) that we are talking not so much about external viruses, but about internal ones — retroviruses-transposons living in our genome, which are activated somewhere after age 45–50. Andrey Gudkov even coined a term for this group — “retrobiome”, and together with his colleagues has shown that if the activity of retroelements is suppressed with the help of reverse transcriptase inhibitors (which creates DNA copies of these retroelements in the cytoplasm), then interferon activity is significantly reduced. But transposons are a separate topic that deserves its own article.
Not all clocks are created equal
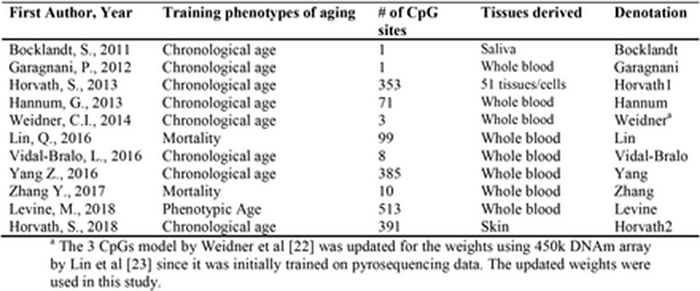
I should mention here that more than a dozen different human methylation clocks already exist, and they are rather heterogeneous. Morgan Levine et al. have produced an excellent analysis of various clocks. As you can see from their table below, some of the clocks were initially trained for correlation with passport age, others with mortality. In some, there are hundreds of methylation sites, in others — very few:
Some show a high level of synchronization between tissues (the original Horvath clock is still in the lead here), others — a low one:

It seems to me that this reflects various age-related epigenetic processes: for sure, there are some tissue-specific epigenetic aging processes, but there are also global, systemic ones. Different clocks reveal different aspects of these processes. And, of course, we are still in the early stages of our journey to unravel the biological meanings of these processes. But I am sure that eventually we will figure them out.
Turning off “good” genes with age
Returning to functional age-related changes, in the second part of the above quote from Morgan Levine, I was intrigued to once again see evidence that the activity of DNA damage recognition and repair pathways epigenetically decreases with age in humans. Incidentally, this contrasts with data in mice, where Gladyshev’s group saw the opposite trend.
But what mice and humans agree on is that with age, the activity of DNA transcription and translation mechanisms, including the construction of ribosomes themselves, epigenetically decreases. The MSU Gladyshev group had a great poster about age-related decline in ribosomal function in the 2018 conference in Kazan. Here is a quote from their abstract from that conference:
We observed an age-related decrease in the expression levels of many genes associated with translation, including genes involved in ribosomal biogenesis and mRNA recruitment. It was unexpected to see that [in the results of ribosomal profiling of cells after fixation] with age, the number of ribosomes on start codons decreased, but increased on stop codons, which corresponded to the systemic degradation of proteostasis with aging.
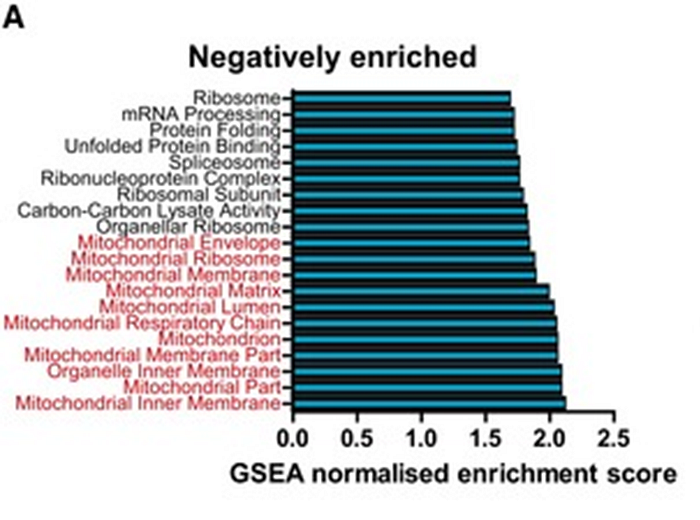
Corroborating the observations of the Gladyshev group, there are works of other groups showing that the activity of building ribosomes and gene translation, in general, decreases with age. Here is, for example, a work in mice, which showed an age-related decrease in the expression of not only ribosomal, but also mitochondrial genes (highlighted in red below) in mouse cardiomyocytes:
More recently, a very beautiful work on rats was published, where the authors traced age-related changes in gene expression in 4 types of tissues: liver, kidneys, muscles (gastrocnemius) and brain (hippocampus). This work also observed similar themes: activation of innate immunity genes (block 1 in the graph below) and a decrease in mitochondrial function genes (block 7):
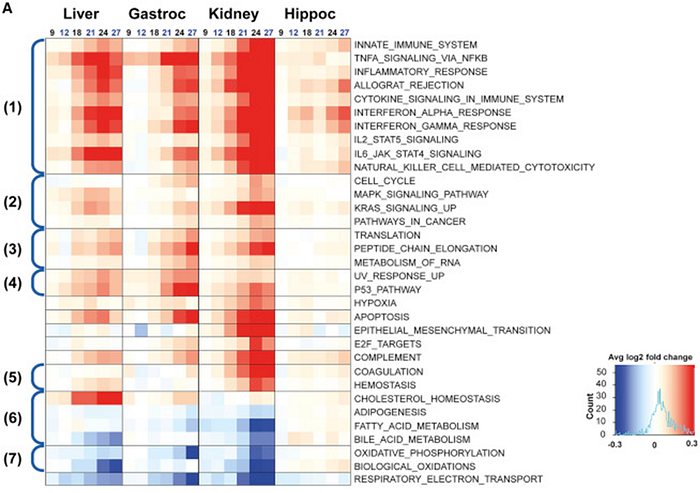
It is interesting to observe, however, that gene expression in the hippocampus did not change that much compared to the other three tissue types. It looks like the brain, or at least the hippocampus, is aging slower than other organs. But in muscles and kidneys, apoptosis genes significantly increase their activity in old age, which can explain both age-related sarcopenia and renal failure. Here’s how the authors summarize their findings:
Most strikingly, pathways that were related to up-regulation of inflammation were the dominant theme that we observed; for example, pathways related to the innate immune response, inflammation, and cytokine signaling were up-regulated with age in the liver, gastrocnemius, and kidney (Figures 4A and 4B). Age-related up-regulation of these pathways was also seen in the hippocampus, albeit with a less-dramatic increase. Pathways linked to allograft rejection and interferon alpha and gamma responses increased strongly with age in kidney, liver, and gastrocnemius muscle and were also increased in the hippocampus (Figures 4A and 4B). The complement pathway was also up-regulated with age in all four tissues. In addition to inflammation, other pathways of interest were perturbed; the apoptosis pathway was overall up-regulated in aging liver, gastrocnemius, and kidney and to a lesser extent in hippocampus, suggesting an overall increase in cell death occurring in tissues with age.
…
The most prominent pathway down-regulated with aging was mitochondrial; oxidative phosphorylation, respiratory electron transport, and biological oxidation were all gradually down-regulated with age in the liver and kidney. Prominent down-regulation of oxidative phosphorylation and respiratory electron transport was seen in the gastrocnemius muscle. Age-related regulation of oxidative phosphorylation, respiratory electron transport, and biological oxidation pathways was not conspicuous in the hippocampus (Figures 4A and 4B). These changes were consistent with the idea that the mitochondria become less competent with age, depriving cells of critical supplies of ATP, in addition to the multitude other signals, which are mitochondrial in origin.
There is other evidence that “good” genes are turned off with age. Here is another great paper, in which the authors analyzed the methylome and transcriptome of leukocytes, and were able to find in these cells those genes whose expression correlated with changes in their methylation. As has been shown elsewhere, many of the gene cascades that change significantly with age are associated with the immune system:
To analyse the processes associated with the genes that displayed a correlation between expression and methylation levels, we performed GO term analysis and IPA for the nonagenarians. We identified 20 GO process terms (Bonferroni-corrected p-value <0.05), of which 6 (30%) were immune system associated. Numerous immune system pathways were also identified when considering GO process terms that were more loosely associated with these genes (Benjamini-Hochberg-corrected p-value <0.05), where 39 of 121 (32%) statistically significant GO process terms were immune system associated (Additional file 12). Only one GO function term (GO:0005515 Protein binding) was associated with the correlated CpGs. In addition to the immune system, pathways related to the reaction to the environment were affected. Ingenuity canonical pathway analysis revealed 15 canonical pathways (Benjamini-Hochberg-corrected p-value <0.05) (Table 6), the majority of which were directly immune system associated (Crosstalk between Dendritic Cells and Natural Killer Cells, Antigen Presentation Pathway, Fcγ Receptor-mediated Phagocytosis in Macrophages and Monocytes, T Helper Cell Differentiation) or associated with cytoskeleton remodelling and endocytosis (Integrin Signalling, Actin Cytoskeleton Signalling, Tec Kinase Signalling, Paxillin Signalling, Caveolar-mediated Endocytosis Signalling).
But most of all I liked the conclusion of the authors in bold, because it completely coincides with my understanding:
We find that certain ageing-associated immune-system impairments may be mediated via changes in DNA methylation. The results also imply that ageing-associated hypo- and hypermethylation are distinct processes: hypermethylation could be caused by programmed changes, whereas hypomethylation could be the result of environmental and stochastic processes.
The authors of this very detailed work saw something similar:
Notably, we observed an increased DNA methylation level at the BACH2 locus and decreased BACH2 expression in CD4+ T cells of the middle-aged and long-lived groups compared with the newborn group. BACH2 plays a crucial role in T-cell-mediated immune responses.
…
This finding suggests that BACH2 down-regulation may be associated with T cell senescence, which may be controlled by DNA hypermethylation at the BACH2 locus in addition to histone modifications.
By the way, since we are talking about the role of epigenetics in hematopoiesis, I cannot but mention my other favorite paper. In it, the authors turned off the DNMT3A gene in hematopoietic stem cells of mice, that is, the gene of one of the methylases — enzymes that perform DNA methylation. And these cell lines became essentially immortal:
Here we show that Dnmt3a-null HSCs can regenerate over at least 12 transplant generations in mice, far exceeding the lifespan of normal HSCs. Molecular characterization reveals that this in vivo immortalization is associated with gradual and focal losses of DNA methylation at key regulatory regions associated with self-renewal genes.
That is, after suppressing the activity of one of the methylases, in the cells immortalized in this way, the authors saw a decrease in methylation in the regulatory regions of the genes responsible for the renewal of these very cells. A reasonable question creeps in: why, in ordinary mice, these important genes are methylated with age? These observations suggest that the degradation of hematopoietic stem cells that we observe with aging may well be caused not by external factors (wear and tear, fatigue from tough life), but by internal ones — the age-related epigenetic program.
What about other tissues? There are also interesting observations there. Here, for example, a group of German researchers saw the following epigenetic changes in intestinal tissues of mice (cells of intestinal crypts and intestinal stem cells):
We discovered hypermethylation both on genes important for intestinal homeostasis (e.g. Wnt3a, Cbx6, Pak3, Nr5a2) and on genes often epigenetically silenced in cancer (e.g. Cdk, Dkk, Sfrp gene family). These findings point out that aging-dependent CpG island hypermethylation could have a key role in both promoting intestinal loss of functionality (by silencing factors necessary to maintain intestinal structure and differentiation ability) and contributing to cancer initiation.
In summary, I believe that a rather large body of data has already been accumulated to support the idea that epigenetic changes are a driver of many (most) age-related pathologies.
Not by methylation alone
DNA methylation is a regulatory feature of gene networks in mammals and other vertebrates. But there are species in which DNA methylation either does not exist at all, or it does not play a regulatory role in epigenetics. However, these species do have histone epigenetic regulation — as, of course, do we, and ours is usually synchronized with our DNA methylation (repressed DNA methylation configurations coincide with repressed histone configurations, and vice versa):
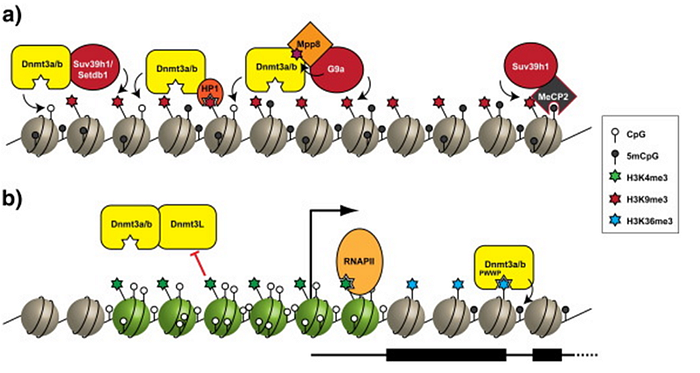
By the way, to me the fact that all eukaryotes (including unicellular yeast) have histone regulation, but not all of them have regulatory DNA methylation, suggests that DNA methylation is a much younger evolutionary mechanism of epigenetic control.
But I digress. What I wanted to show is that even in much more “primitive” species than us or mice, there is an epigenetic switch-off of “good” genes with age. One of my favorite examples is the playfully titled nematode paper Shockingly Early: Chromatin-Mediated Loss of the Heat Shock Response. In it, the authors showed that the heat shock response, one of the main mechanisms of protein quality control, is epigenetically disabled in nematodes. Moreover, it turns off suddenly and at a fairly early age: only within 4 hours after puberty:
The heat shock response (HSR) is essential for proteostasis and cellular health. In metazoans, aging is associated with a decline in quality control, thus increasing the risk for protein conformational disease. Here, we show that in C. elegans, the HSR declines precipitously over a 4 hr period in early adulthood coincident with the onset of reproductive maturity.
Repression of the HSR occurs due to an increase in H3K27me3 marks at stress gene loci, the timing of which is determined by reduced expression of the H3K27 demethylase jmjd-3.1. This results in a repressed chromatin state that interferes with HSF-1 binding and suppresses transcription initiation in response to stress.
…
We found that the inducibility of the HSR is reduced by 60%–70% between 8 and 12 hr into the first day of adulthood and coincides with the onset of egg laying (Figures 2F and S2E). This suggests that repression of the HSR represents an actively controlled transcriptional re-tuning that marks the onset of reproductive maturity and could represent an early molecular event in the aging process. Furthermore, rapid repression of the HSR correlates with a dramatic impairment in the ability of animals to recover from acute heat shock (Figure 2G), suggesting that the transcriptional switch mid-way through the first day of adulthood has profound consequences for the organism.
…
Our data suggest that stress response pathways are not gradually and progressively dysregulated as a consequence of stochastic damage with age but are instead rapidly and precisely repressed as animals commit to reproduction.
Isn’t that obvious phenoptosis? By the way, a very similar epigenetic shutdown of proteostasis systems (maintaining the quality of proteins), only in rotifers, was observed by the authors of this work:
A decline in protein homeostasis is considered one of the hallmarks of aging across taxa [1], and our results suggest such a decline in late life in B. manjavacas. Expression of nearly all proteasome-related genes increases steadily over life until the transition to reproductive senescence, when expression of 31 out of 38 annotated structural proteasome subunit and catalytic co-factor genes decreased by up to 2.4-fold (Fig. 8); GSEA results capture the late-life decline in proteasome expression (Fig. 5).
…
Together, these results suggest that large shifts in epigenetic markers may be partly or even largely responsible for driving the changes in gene expression over lifespan, an idea increasingly supported by results from other model systems.
Incidentally, this Fig. 5 shows very clearly how many key organismal systems decrease their activity at the end of the reproductive period:

At the same time, after the end of reproduction age, rotifers live another 20–30% of their lifespan, and nematodes may live a whopping 80% — the fertile period in nematodes lasts only 3–4 days, after which the worms remain alive for another 2–3 weeks. Why do genes begin to turn off not only important homeostasis systems, but also the reproductive system so early? After all, theoretically, from the point of view of individual selection, prolonging the ability to reproduce would give them an evolutionary advantage. Apparently, there is still selection pressure at higher fractal levels than the level of an individual, which reinforces both phenoptosis and early sterilization in such species.
Could Alzheimer’s also be epigenetically controlled?
Continuing the topic of epigenetically determined age-related degradation, I cannot fail to mention a paper, which even for such a staunch “programmer” as myself came as a surprise. In it, the authors showed that Alzheimer’s disease may be epigenetically reversed. To be honest, I thought that Alzheimer’s was caused by irreversible neuronal death, and that it can only be prevented, not reversed. Fortuitously, it seems I have been wrong.
The authors of the above work noticed that the activity of glutamate receptors is epigenetically suppressed in Alzheimer’s patients. Glutamate is the main neurotransmitter, and its receptors play an important role in memory processes. So, the authors found that this suppression occurs through one of the histone mechanisms of gene repression. The next logical step was to try to block this repressive mechanism and see what happens.
What they observed was close to a miracle: after being treated with inhibitors of the above repressive epigenetic mechanism, mice with significant memory deficits had their memory restored almost to healthy levels. Their cognitive test scores skyrocketed after the injection of a gene repression inhibitor:
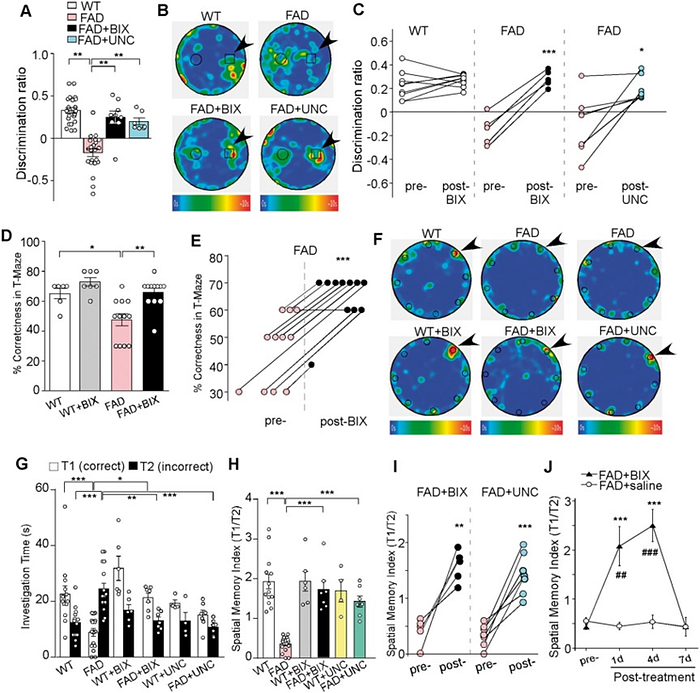
(A) Bar graphs (mean ± SEM) showing the discrimination ratio of novel object recognition (NOR) tests in wild-type (WT) versus FAD mice (5–6 months old) without or with the treatment of BIX01294 (1 mg/kg, s.c. 3x) or UNC0642 (1 mg/kg, i.p. 3x). **P < 0.01, one-way ANOVA. (B) Representative heat maps illustrating the time spent in different locations of the arena for novel object recognition tests of all groups (blue: 0 s; red: ~10 s). Locations of novel (denoted by an arrow) and familiar objects are labelled with the circles or squares. (С) Scatter plots showing the discrimination ratio of novel object recognition tests in each of the examined wild-type or FAD mice before and after the treatment with BIX01294 or UNC0642. *P < 0.05, ***P < 0.001, paired t-test. (D) Bar graphs (mean ± SEM) showing the percentage correctness in T-maze working memory (WM) tests in wild-type or FAD mice with or without BIX01294 treatment. *P < 0.05, **P < 0.01, two-way ANOVA. (E) Scatter plots showing the percentage correctness in T-maze tests in each of the examined FAD mice before and after BIX01294 treatment. ***P < 0.001, paired t-test. (F) Representative heat maps illustrating the time spent in different locations of the arena for Barnes maze tests during the memory phase (escape box removed) in wild-type versus FAD mice without or with the treatment of BIX01294 (1 mg/kg, s.c. 3x) or UNC0642 (1 mg/kg, i.p. 3x) (blue: 0 s; red: ~10 s). Locations of the correct (indicated by an arrow) and seven incorrect holes are labelled with circles. (G) Bar graphs (mean +/ SEM) showing the time spent on exploring the correct hole (T1) versus the seven incorrect holes (T2) in the memory phase of Barnes maze tests of all groups. *P < 0.05, **P < 0.01, ***P < 0.001, two-way ANOVA. (H) Bar graphs (mean +/ SEM) showing the spatial memory index (T1/T2) of Barnes maze tests in wild-type versus FAD mice without or with the treatment of BIX01294 or UNC0642. ***P < 0.001, two-way ANOVA. (I) Scatter plots showing the spatial memory index in Barnes maze tests in each of the examined FAD mice before and after the treatment with BIX01294 or UNC0642. **P < 0.01, ***P < 0.001, paired t-test. (J) Plots (mean +/ SEM) of spatial memory index in FAD mice treated with BIX01294 (1 mg/kg, s.c. 3x) or saline at different time points. **P < 0.01, ***P < 0.001, saline versus BIX01294; ##P < 0.01, ###P < 0.001, pre- versus post-injection, two-way ANOVA. Each set of the experiments was replicated between four and five times.
Noticeably, the effect of this therapy was rather short-lived: 7 days after the administration of the drugs, the memory of the mice deteriorated back to its initial levels, which suggests that this is exactly how much time it takes for that histone repressive mechanism to restore the “bad” epigenetic profile of the activity of glutamate receptor genes. But most importantly, we saw the first signs of an absolutely startling prospect: Alzheimer’s could be epigenetically reversible.
Epigenetic rollback (rejuvenation)
Ok, I think I’ve provided enough examples of just how many bad things that happen as we age are due to epigenetic mechanisms. So let me remind that there is a silver lining in this — epigenetic changes are reversible! The most striking example of this is the epigenetic rollback accomplished via OSKM reprogramming and the accompanying functional rejuvenation of cells. Indeed, Yamanaka factors are able to rejuvenate cells even from centenary donors: for example, to restore their mitochondrial function.
Moreover, we are very fortunate that Yamanaka factors reduce epigenetic age gradually. This preprint demonstrated this beautifully for human fibroblasts — namely, that the decrease in their epigenetic age (blue curve in the graph below) is gradual, as is the decrease in the expression of functional genes that are responsible for fibroblasts remaining fibroblasts:
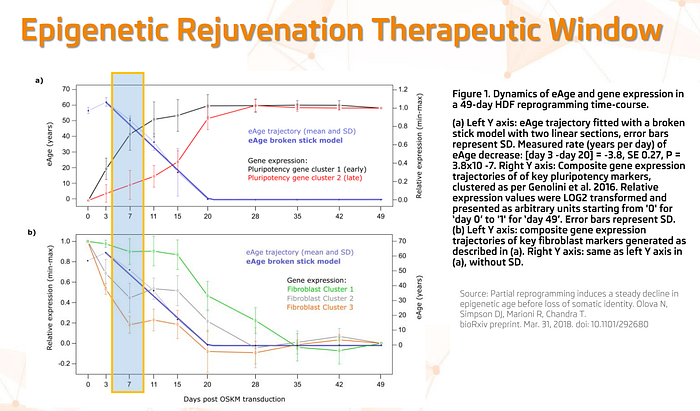
The discovery of this gradual property of epigenetic reprogramming allows us to hope that we will be able to find a safe therapeutic window (for example, marked by a blue rectangle in the graph above) — that is, a time period of safe epigenetic rollback, when the cell is already epigenetically rejuvenated, but has not yet lost its functional characteristics ( i.e. the skin cell remains a skin cell and does not dedifferentiate into a pluripotent cell).
By the way, I was not the only one who fell in love with the above smooth rollback graph at first sight. It is also featured in presentations of such gurus as Steve Horvath or Mike West. And yes, it’s nice to see that since I got inspired by epigenetic rejuvenation by partial reprogramming back in 2017 and founded Youthereum, several more companies have also committed to translating this paradigm into a therapy. These are Turn Biotechnologies from Stanford; AgeX spin-off REVERSE Bioengineering; as well as the famous David Sinclair with his Iduna.
Could epigenetic clocks just be a reflection of DNA damage?
Having mentioned David Sinclair, I would like to circle back to the beginning of this article and elaborate on the difference between the Weak and the Strong Epigenetic Theories of Aging.
While I share David Sinclair’s optimism about the value of partial reprogramming for epigenetic rejuvenation, I have differing understanding of the actual mechanisms of age-related epigenetic changes. In his talks and a recent preprint (co-authored with Vadim Gladyshev, by the way), David speaks of aging as a loss of epigenetic information due to the accumulation of epigenetic noise, and reprogramming as the restoration of the “correct” epigenetic settings from some kind of informational backup.
Within this paradigm, David and his supporters believe that the epigenetic clock only reflects stochastic breaks in our DNA. They believe that the methylation sites on which the epigenetic clock is built are nothing more than sites of repairs of double-strand breaks that randomly appear with age.
I disagree with this thesis for at least two reasons. First, methylation levels of CpG sites in various methylation clocks change in opposite directions with age. For example, in the Horvath clock, about half the sites increase, while the other half decrease. Which of these processes reflects DNA repair in the above thesis? Secondly, as the clock sites are the same for all humans, and their levels are highly similar at the same age, it seems naive to think that with age, DNA breaks would occur in all humans in the same spots and with about the same frequency. Moreover, in identical ways in different tissues: in the brain, skin, blood, etc. After all, as I already mentioned, CpG sites in the Horvath methylation clock are universal for 51 types of cells: both rapidly dividing and not dividing at all after birth.
In support of their thesis, David Sinclair and co-authors have recently released another preprint with a telling title “Epigenetic drift caused by DNA breaks as a cause of aging in mammals”. In this work, they created transgenic mice in which DNA breaks could be induced at authors’ choosing, and tried to show that excess DNA breaks increase epigenetic age.
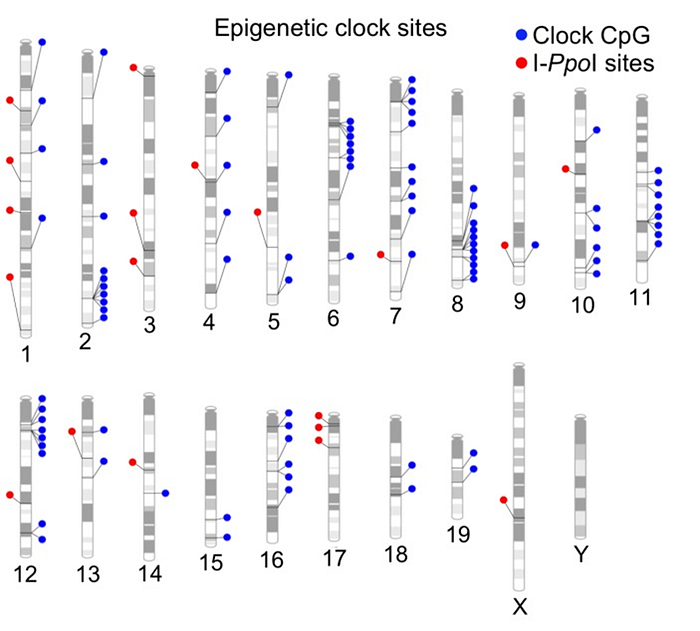
In order to cause such breaks not randomly, but on demand, the authors introduced a special gene cassette with “gene scissors” into the genome of mice, which was not active by default, but was triggered if the mice were given an activator molecule. Moreover, when activated, the “scissors” cut DNA not just anywhere, but in strictly defined 20 sites (red dots in the picture below):
It seems that the authors based their key thesis that it is double-strand breaks that cause aging solely on the fact that the methylation clock in such mice showed a later time after DNA breaks (and even then, only in cell culture). The authors did not provide any data on the effect of such DNA breaks on lifespan of their mice. On the contrary, they cited other works that showed that mice with increased mutagenesis live as long as normal ones.
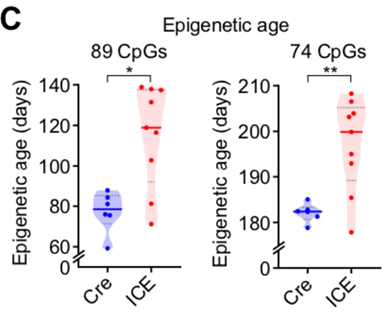
I was also intrigued by the following observation: although the authors said that after inducing DNA breaks in mice their epigenetic age was 1.5 times higher, upon closer examination it turns out that 1.5 times was observed according to some previously unknown methylation clock (left graph below), while when the authors used the previously validated Gladyshev’s clock (right graph), the difference in methylation age was only around 10%. At the same time, the methylation age of the control group differed between the two clocks by 2.5x (!):
Finally, further undermining their own thesis, the authors themselves admit that the sites of their induced double-strand breaks do not at all coincide with the sites of methylation of their methylation clock. This is clearly seen in the previous graph above where methylation sites (blue) and DNA break sites (red) are mapped on murine chromosomes.
In light of these facts, the proposed mechanism of the effect of DNA breaks on methylation put forward by the authors looks unjustified to me. The authors hypothesize that when a DNA break occurs, repressive complexes are irretrievably moved from methylation sites to breaks to repair them. But this does not fit well with the fact that, as I already mentioned, methylation levels of clock CpG sites changes in opposite directions with age. Moreover, the decrease in methylation with age can be explained in a simpler way: just by stochastic erosion during cell division. But how does the above DNA breaks hypothesis explain methylation increases? Recall that addition of methyl groups to CpG sites is an energy-consuming process that is unlikely to occur by chance at the same sites in all individuals of the same age.
To me, another explanation of the nature of methylation clocks and the epigenetic rejuvenation by reprogramming is much more plausible. I believe that Yamanaka factors roll back epigenetic settings to a younger state not because young settings are secretly recorded somewhere in the backup, but because the rollback of the epigenetic aging program as the initial stage of dedifferentiation is a mechanism inherently programmed in our genes. Perhaps the same mechanism is used to rejuvenate the egg after fertilization. In general, the immortal germ line has a couple more tricks up its sleeve for its rejuvenation, thanks to which an old egg cell has been turning into a new individual for millions of years without any problems — I hope that someday I will turn my two-hour lecture on this topic into a full-fledged article.
But I got distracted again. Returning to epigenetic rejuvenation by partial reprogramming, the very fact that it is possible, and occurs smoothly, tells me that the decrease in the expression of “good” genes with age is also epigenetically programmed, and does not occur randomly due to some kind of “noise”. After all, if it were a random process, we would not have any epigenetic clocks, since the variation between people would be too large, and would only increase with age. There would also be no epigenetic rollback: after all, reprogramming is an obviously smooth process, ending with a complete loss of differentiation and the transformation of a cell into a pluripotent one. Moreover, the epigenetic settings of the final pluripotent (essentially embryonic) cell are clearly different from the settings of a “young” differentiated cell of the type that it was before it was reprogrammed. That is, an old fibroblast is much closer to a young fibroblast in its epigenetics than to the pluripotent cell. So which of these “young” epigenetic settings would be recorded in a backup? And which of them are considered “young”? Before puberty? Right after? Clearly, there are more questions than answers stemming from the DNA breaks epigenetic hypothesis.
On the basis of the above, I strongly believe that aging is an epigenetic program. Luckily, the differences between the Weak and the Strong Epigenetic Theories of Aging might be more academic than practical. In practicality, many if not most aging researchers agree that, regardless of how it works, we should continue studying the wonderful phenomenon of epigenetic rejuvenation by partial rejuvenation with a goal of creating therapies that could provide humanity with significant life extension. I am positive that one day we will tame this approach to help us slow down and even reverse our epigenetic clocks. Let’s work together to help this day come sooner. Because death does not become a truly intelligent species.

References and Further Reading
In addition to the references linked to throughout the text, here are other important works that have shaped my understanding of aging mechanisms:
- Mitteldorf, J, 2016, An Epigenetic Clock Controls Aging, Biogerontology, 17:257–265
- Mitteldorf, J, 2017, Aging is a Group-Selected Adaptation. Theory, Evidence, and Medical Implications
- Adiv Johnson et al, Rejuv Res 2012, The Role of DNA Methylation in Aging, Rejuvenation, and Age-Related Disease
- Rando & Chang, Cell 2012, Aging, rejuvenation, and epigenetic reprogramming: resetting the aging clock
- Horvath, S, and K. Raj, 2018, DNA Methylation-based Biomarkers and the Epigenetic Clock Theory of Ageing, Nature Reviews, 19:371–384
- Galkin, F, 2020, Biohorology and biomarkers of aging: Current state-of-the-art, challenges and opportunities, Aging Research Reviews 60:1–13